I’m sure everyone thinks their age group is “special.” I know the Millennials do! But our age group is actually special in a number of ways. Let me explain.
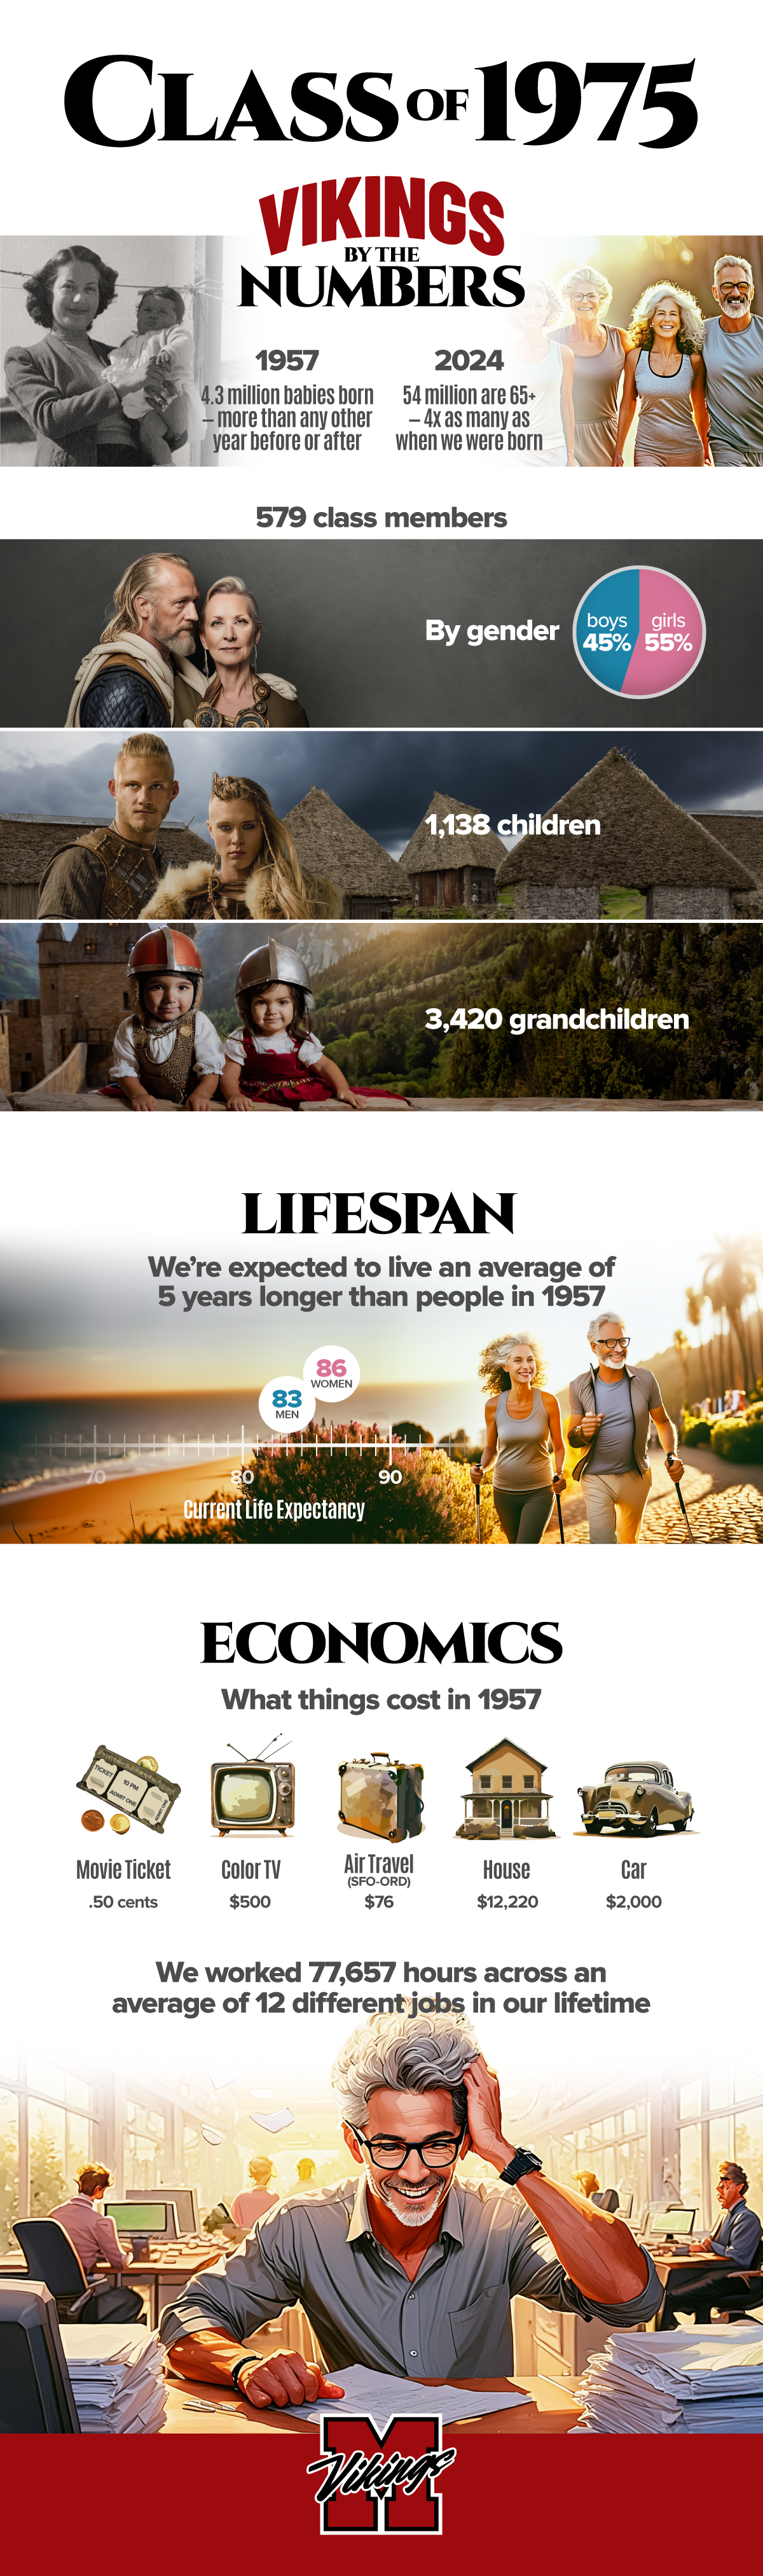
First, there is the whole “Boomer” thing. The Baby Boom refers to the explosion in births that came after World War II. The “Boomer” generation are people born from 1946 to 1964. You know that, of course, but did you know which year was the “boomiest” of all the years? That’s right, 1957. There were 4.3 million of us born that year – more than in any year before or after.
What’s more is that we’re still here and aren’t going anywhere! There are currently 54 million seniors (65 or older) in the US. That’s more than four times the number of seniors in the year we were born.
Vikings
Let’s zoom into something more specific – the class of 1975. There were 579 of us. Did you know there were 20% more girls than boys (55% versus 45%)? I’m not sure exactly how many of us are still standing, but actuarially speaking, we probably have about 470 left.
That begs the question of how many of us will attend the 50th reunion. It’s hard to say, but my research uncovered a fascinating fact – the 50th is by far the most well-attended high school reunion. That’s surprising at first but less so when you think about it. I mean, what are we waiting for? The 51st? This is probably the last big reunion we’ll have.
The Next Generation

We’ve left a pretty big wake in our path. Based on averages, we probably have 1,138 children and 3,420 grandchildren. I see a lot of the next generation in proud Facebook posts, and it looks like we’re in good hands!
Economics
Here is an interesting stat—our classmates held an average of 12 different jobs in their lifetime and worked a total of 77,675 hours. And we are much better off today. In 1957, the average annual wages were $4,713 (about $48K in 2024 dollars). But the actual average yearly wages in 2024 were higher—$59,384. That means wages rose 24% more than inflation during our lifetime.
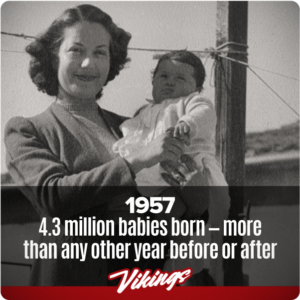
That begs the question of how prices have fared since 1957. Here are some core prices and how much they’ve risen (or fallen) since 1957:
Things that cost MORE today
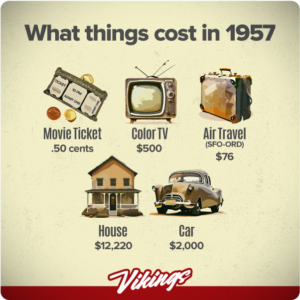
- Cars averaged $2,000 in 1957 ($20,353 in 2024 dollars). But cars now average $47,433 – 2.3 times as much in 2024 dollars. Of course, they are now way nicer, so it’s hard to compare.
- Houses averaged $12,220 in 1957 ($124,360 in 2024 dollars). But houses now average $393,500 nationally – 3.2 times as much in 2024 dollars. Of course, like cars, houses are now way nicer, so it’s hard to compare.
Things that cost LESS today
- Air Travel was expensive in 1957. A SFO-Chicago economy ticket cost $76 in 1957 ($773 in 2024 dollars). But that same ticket now costs $150 – 5.2 times less in 2024 dollars.
- Color TVs cost $500 in 1957 ($5,088 in 2024 dollars). But Amazon sells a color TV that would put that 1957 model to shame for just $89! That is a whopping 57 times cheaper in 2024 dollars.
Lifespan
The biggest gain? Lifespan! People are living roughly five years longer today than in 1957. Life expectancy is now 83 for men and 86 for women. The good news is that life expectancy continues to rise, so we may be looking at even higher numbers as we age.
This is pretty encouraging, especially considering that the average Viking lived only 40-45 years in 800 AD.